Squash Performance Dashboard
This guide documents a personal project: a data dashboard I built to track my squash match history and performance since 2016. I wrote it as a sample of reference documentation for a custom analytical tool. View the live dashboard at xmacvicar.github.io/davids-squash-dashboard.
The dashboard aggregates match data from league play and tournaments from 2016 to present. It surfaces patterns that are difficult to see match-by-match: how win rates shift across seasons, how performance holds up in long matches, and how ranking trajectory compares to raw win percentage.
Navigating the dashboard
The dashboard is organized into six tabs across the top of the page:
- Overview: career snapshot, win/loss summary, and game-level stats
- Match Log: full chronological record of every match
- Opponents: head-to-head records against opponents faced two or more times
- Yearly Trends: season-by-season analysis and performance patterns
- Head to Head: complete match history against a selected opponent
- Rankings: rating and rank position over time from 2019 to present
Click any tab to switch views. Each tab is independent; filters applied in one tab do not carry over to others. Use the sun/moon button at the right end of the navigation bar to switch between light and dark mode.
Overview
The Overview tab is organized into three groups: Career Snapshot, Career Wins / Losses, and Game-Level Stats.
Career Snapshot
Five summary cards appear at the top of the page:
- Matches Played: total career matches
- Total Wins: win count and overall win rate percentage
- Total Losses: loss count and overall loss rate percentage
- Tournaments: number of distinct tournaments entered
- Unique Opponents: total number of different players faced
Below the cards, the Results per Year bar chart shows wins and losses grouped by season, covering all tournament and league matches from 2016 to 2026.
Career Wins / Losses
Three donut charts break down the win/loss record by match context:
- Overall: all matches combined
- Tournaments: competitive events only
- League: Montreal league matches only
Separating these categories matters because tournament and league opponents can differ significantly in level, and mixing them obscures both records.
Best Winning Streak and Recent Form
Best Winning Streak shows the longest consecutive run of wins in the career dataset, with the month and year the streak began.
Recent Form shows the result of the last ten matches as colored tiles, most recent on the right. Hover over any tile to see the opponent and date.
Game-Level Stats
Three cards break down performance at the individual game level:
- Games Won: total games won across all matches
- Games Lost: total games lost across all matches
- 3-0 Straight Wins: matches won without dropping a game, shown as a count and as a percentage of total wins
Bagel Meter tracks any match in which a game score of 0 was conceded. If the record is clean, the panel notes it; otherwise it lists each match where a bagel occurred.
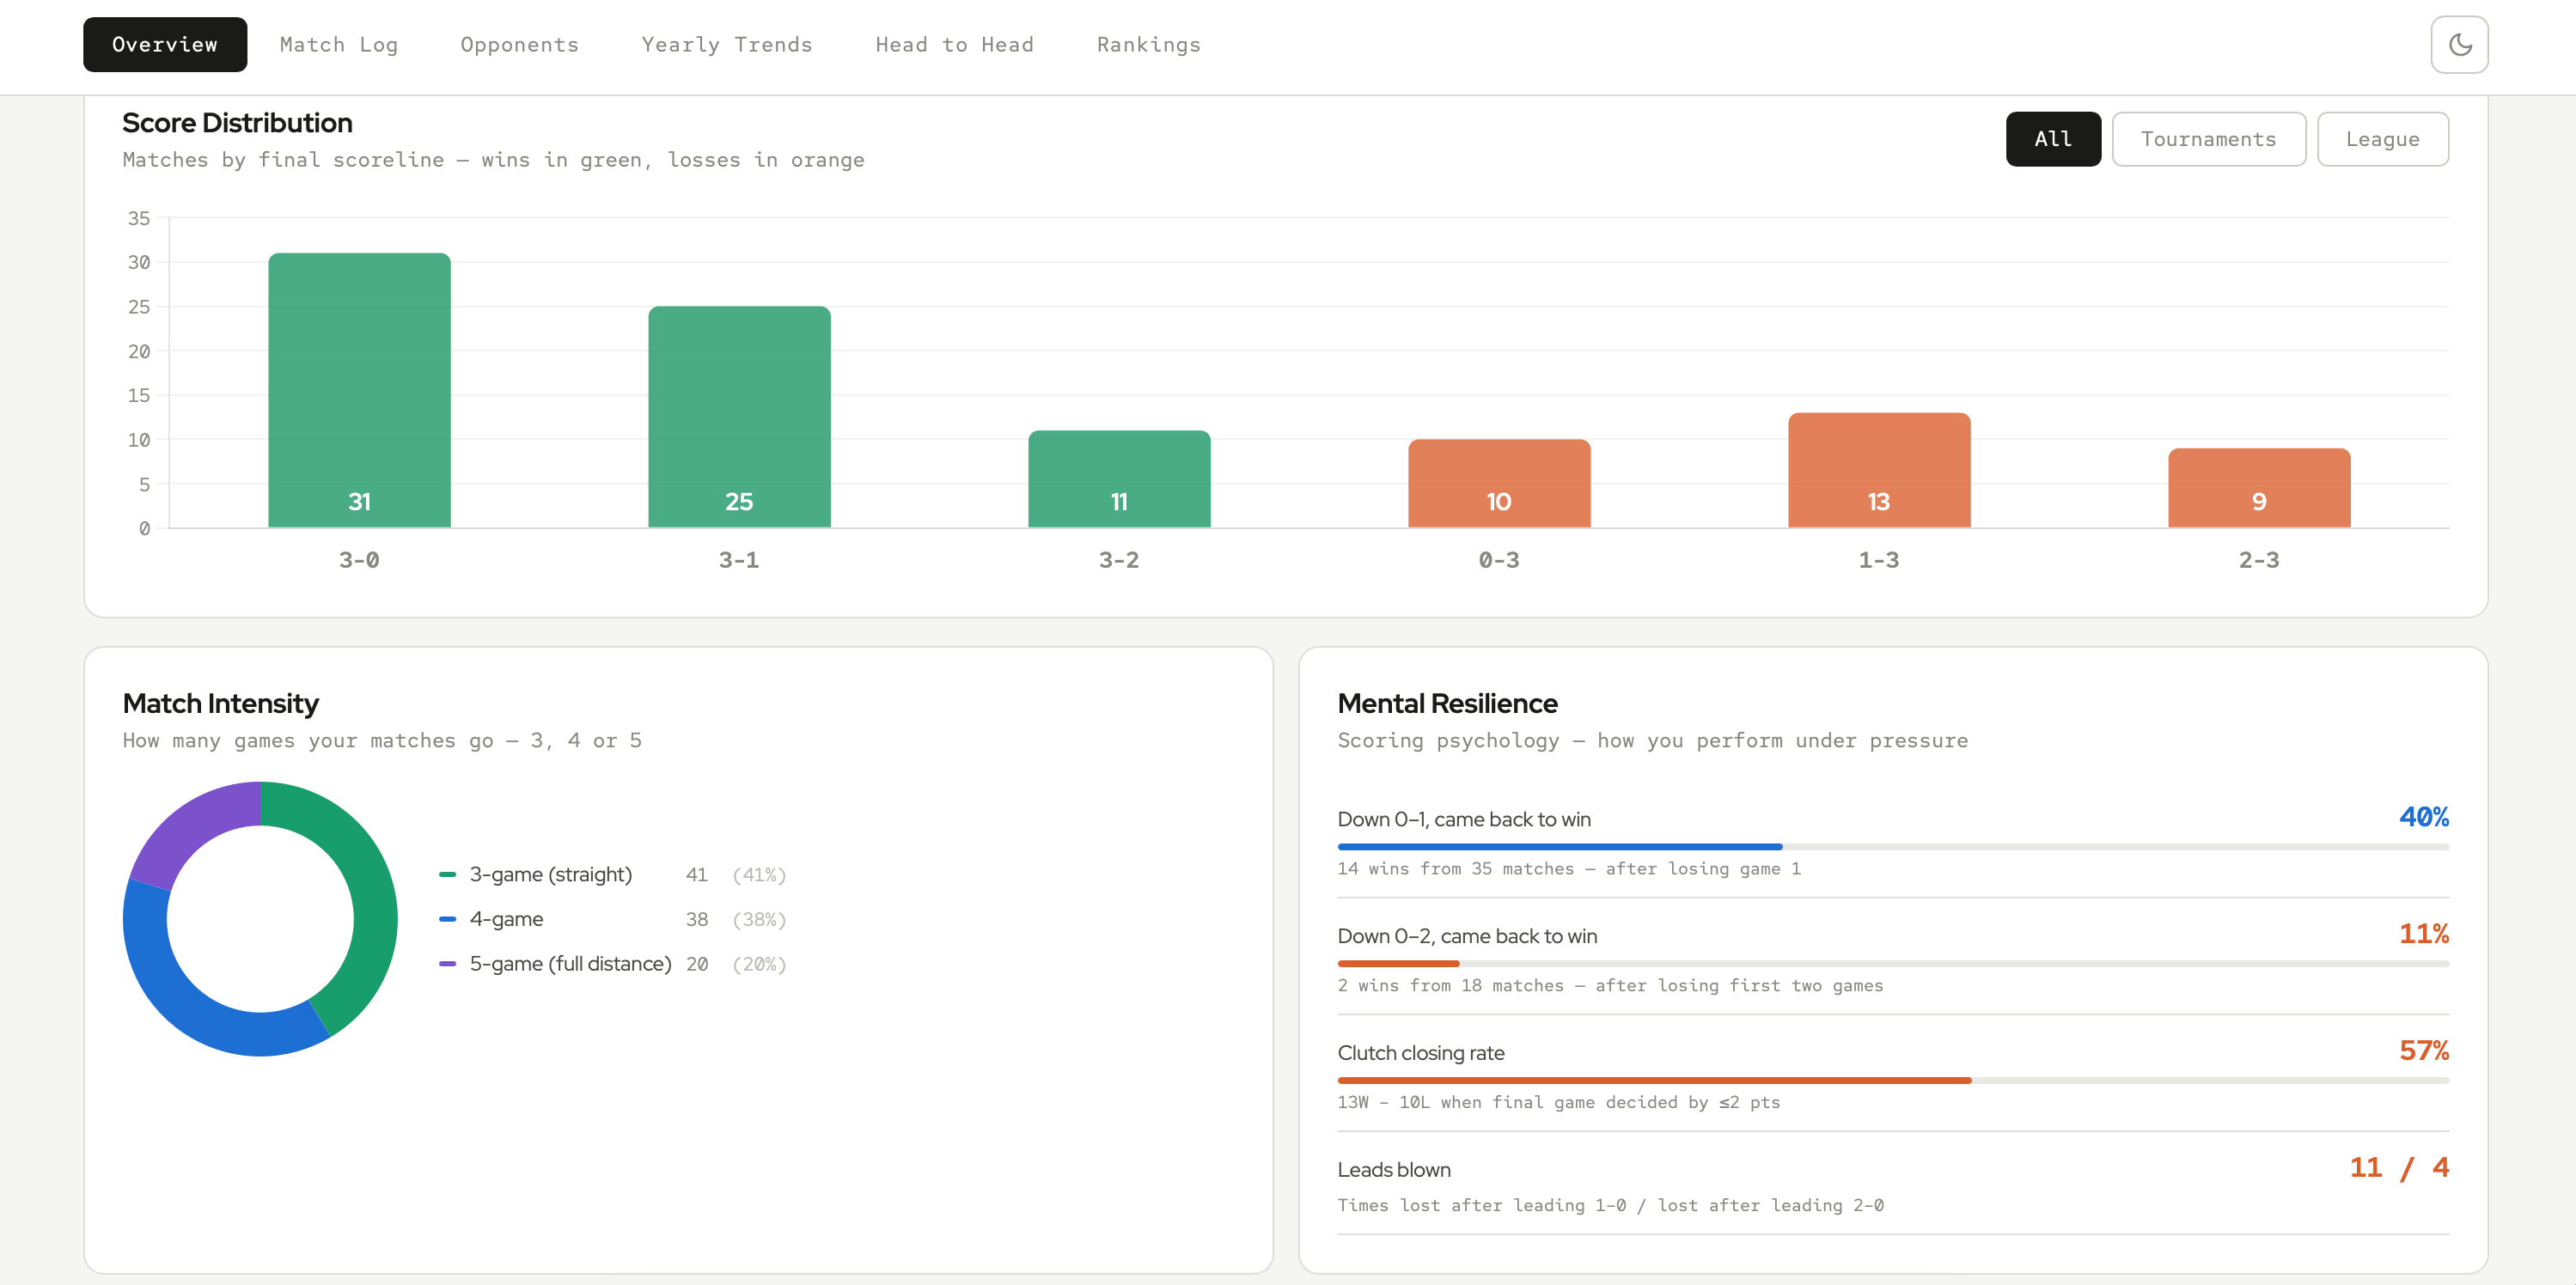
Score Distribution shows how often matches ended at each possible scoreline. Wins appear in green, losses in orange. Use the All, Tournaments, and League buttons to filter the chart by match type.
Match Intensity shows what percentage of matches went three, four, or five games:
- 3-game (straight): matches decided in the minimum number of games
- 4-game: matches that required a fourth game
- 5-game (full distance): matches that went the full five games
Mental Resilience tracks performance under pressure across four metrics:
- Down 0-1, came back to win: win rate in matches where the first game was lost
- Down 0-2, came back to win: win rate in matches where the first two games were lost
- Clutch closing rate: win rate in matches where the final game was decided by two points or fewer
- Leads blown: number of times a match was lost after leading 1-0, and after leading 2-0
Match Log
The Match Log is the full chronological record underlying all other views. Use the filter tabs to narrow by result or match type: All, Wins, Losses, Tournaments, or League.
Each row in the table includes:
| Column | Description |
|---|---|
| Date | Match date |
| Opponent | Opponent name |
| Event | Competition name |
| Result | Win or Loss |
| Score | Final match score (e.g. 3-1) |
| Game Scores | Score of each individual game |
| Type | League or tournament |
Click any column header to sort by that field. The count below the table updates to show how many matches are currently displayed.
Opponents
The Opponents tab lists every opponent faced two or more times. Each row includes:
- #: rank by total matches played against this opponent
- Opponent: player name
- Played: total matches
- Won / Lost: raw counts
- Win%: win percentage across all meetings
- Record: shorthand notation (e.g. 4-2)
Sort by Win% to identify opponents with favorable or difficult historical records. Sort by Played to find the most frequent opponents.
Yearly Trends
The Yearly Trends tab is divided into two sections.
Season-by-Season Analysis
- Win Rate by Year: win percentage per season plotted as a line chart
- Tournaments per Year: number of distinct tournaments entered per season
- Season Breakdown: a table showing the full record for each year, including wins, losses, total matches, and win percentage
Performance Patterns
- Win Rate by Month: win percentage grouped by calendar month. Bars are colored green (above 70%), blue (50-70%), or orange (below 50%), making peak and weak months immediately visible.
- Tournament vs League: a side-by-side comparison of win rate in competitive events versus league play, with match counts for each format
- 5-Game Match Record: win/loss record in matches that went the full five games, with an overall win rate for those matches
Head to Head
Select an opponent from the Select opponent dropdown. The panel loads the complete history between you and that player:
- Win and loss counts shown as large scores, David in blue and opponent in orange
- A proportional win bar showing each player's win percentage across all meetings
- A Match History table listing every match, with date, result, event name, match score, and individual game scores
This view is useful for match preparation: reviewing game-level scores from previous meetings reveals patterns in how specific matchups unfold.
Rankings
The Rankings tab tracks rating and rank position from 2019 to present. Five current-ranking cards appear at the top, each showing the current rank, the best-ever rank, and the four-week change.
Rating Over Time
Rating Over Time plots the Universal Squash Rating (USR) across the full career. USR is a global, algorithm-based rating updated after each match result. A higher rating indicates stronger performance relative to the broader player pool.
Use the time range buttons to zoom the chart:
- All time: full career history
- 3 years: the most recent three seasons
- 1 year: the past twelve months
Rank Position Over Time
Rank Position Over Time tracks numerical rank within a selected organisation and division. The chart is oriented so that a higher position always represents a better (lower number) rank.
Select an organisation:
- Squash QC: Quebec provincial rankings
- Squash CA: Canadian national rankings
- Universal: Universal Squash Rating global rankings
Select a division:
- All Men: open men's division
- M40+: men's 40 and over division
Best Rankings Achieved
Best Rankings Achieved lists the all-time peak rank for each organisation and division combination, with the date that peak was reached and the current standing.
All Organisations – Rank Trajectory
This chart overlays rank trajectories from all organisations on a single graph. Each series is normalised independently so that 100% represents the best rank ever achieved in that organisation and division. This makes trends comparable across organisations that use different ranking scales.